

 Português pt
 Español es
 العربية ar
 বাংলা bn
 Deutsch de
 Filipino fil
 Français fr
 हिन्दी hi
 Bahasa Indonesia id
 Italiano it
 Русский ru
 Svenska sv
 ไทย th
 Türkçe tr
 Tiếng Việt vi
 简体中文 zh
Chande Forecast Oscillator: How to Use It in Trading
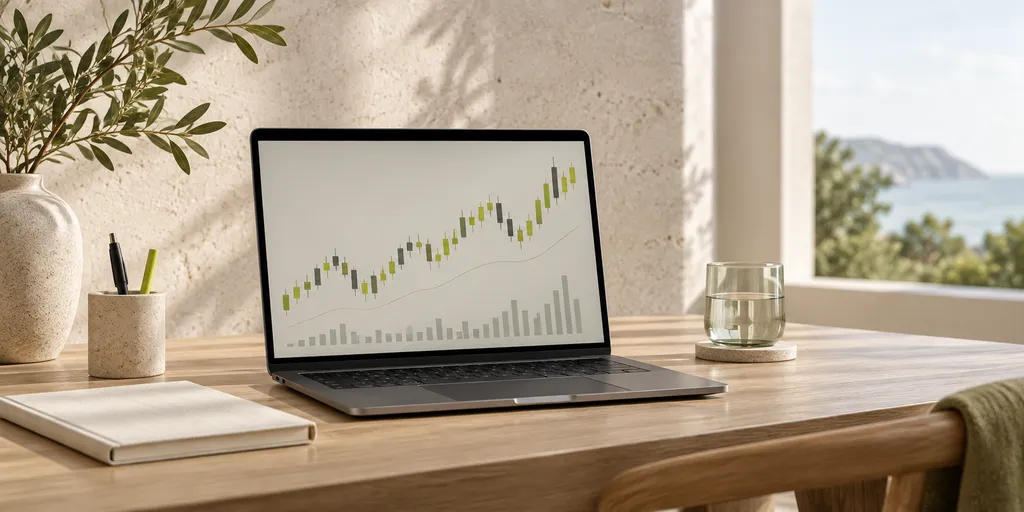
Among the indicators created by analyst and statistician Tushar Chande, the Chande Forecast Oscillator (CFO) is one of the least known outside more technical circles, but it carries an interesting idea: instead of looking only at simple moving averages, it uses linear regression to calculate an "expected" price value and compares that value with the actual price.
In this article, you'll understand the logic behind the CFO, how to interpret it, and how it can complement other trend and momentum indicators.
The idea behind the indicator
A linear regression, applied to a series of prices, draws the straight line that best fits that asset's recent movement — it's a statistical way of saying "if this trend continues exactly as it is, this would be the next expected price". The CFO uses this line to calculate a forecast value for the current candle and then measures the percentage difference between that forecast value and the actual closing price.
When the actual price is above the value forecast by the regression, the CFO turns positive, signaling the market is advancing faster than the recent linear trend suggested. When the price is below the forecast, the CFO turns negative, indicating slower-than-expected progress, or a decline.
How the calculation works, in practice
Suppose the linear regression calculated with an asset's last 14 candles projects an expected price of R$ 48.00 for the current candle, but the actual closing price is R$ 49.44. The percentage difference would be approximately 3% [(49.44 − 48.00) / 48.00 × 100], and that would be the CFO's value on that candle: +3.
A positive, rising CFO suggests the price is moving further above its recent linear trend — which can indicate either a real move of strength or a stretch that tends to get corrected. That's where combining it with other chart elements comes in.
Zero-line crossover
Like other oscillators, the CFO has a central zero line. A crossover from negative to positive indicates the price has started outpacing its own recent linear projection, which is usually read as a signal of buying strength gaining ground. The reverse crossover, from positive to negative, suggests the opposite.
These crossovers tend to work better as confirmation of a move already underway than as an early reversal signal, since the calculation depends on the linear trend of previous periods.
Choosing the regression period
The period used to calculate the linear regression also significantly influences the CFO's reading. A short period, like 5 or 9 candles, makes the indicator more sensitive to recent changes, generating crossovers and swings more often, useful for those trading shorter time frames, but also more prone to noise. A longer period, like 20 or 30 candles, smooths out the regression line and makes the CFO react more slowly, reflecting more established trends.
There's no universal fixed period: the ideal approach is testing different values on the same asset and watching which setting produces readings that make sense given that market's historical behavior, instead of simply copying another indicator's default period.
Divergences in the CFO
Just like with the RSI, you can observe divergences between the CFO and the price. If the price makes a new high, but the CFO shows a lower reading than at the previous high, that suggests that, despite the price rising, it's moving less and less away from its recent linear trend — a sign of weakening strength that can precede a correction.
Combining the CFO with other indicators
Being a linear-regression-based indicator, the CFO tends to react similarly to trend indicators, so it usually doesn't make sense to use it alongside several different moving averages — the signal would become redundant. It works best complemented by a volume or volatility indicator, which bring a different dimension to the analysis.
On Astron, it's worth testing the CFO across different regression periods and comparing its reading with the actual price behavior on assets you already follow, before incorporating it as part of a strategy. Like any statistical indicator based on past data, the CFO projects a trend that may not hold up, and every entry decision should account for the trade's real risk of loss.
Practice before you risk. Open your Astron account and test your ideas on the demo account with R$ 10,000 in virtual funds.
Create free account