

 Português pt
 Español es
 العربية ar
 বাংলা bn
 Deutsch de
 Filipino fil
 Français fr
 हिन्दी hi
 Bahasa Indonesia id
 Italiano it
 Русский ru
 Svenska sv
 ไทย th
 Türkçe tr
 Tiếng Việt vi
 简体中文 zh
Envelopes Indicator: Moving Average Bands in Practice
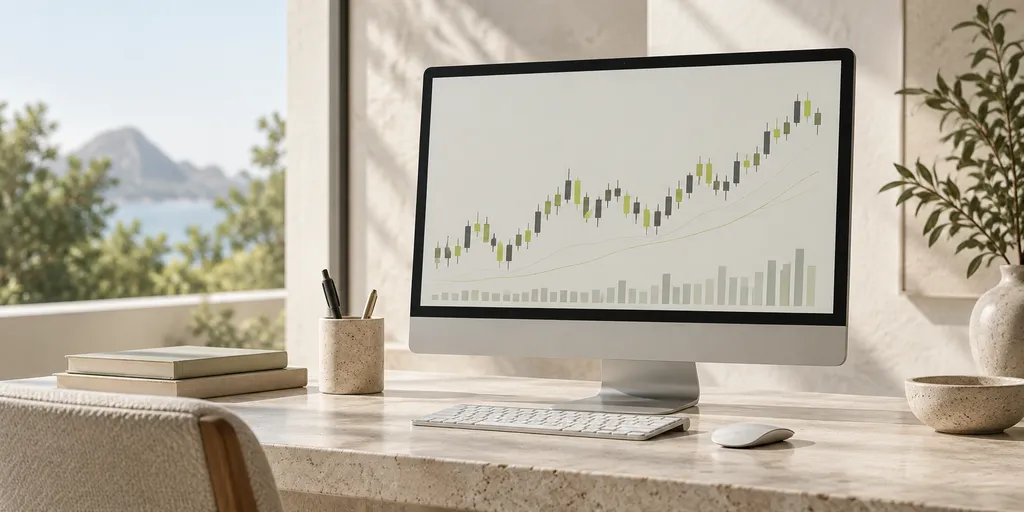
The Envelopes indicator follows a logic similar to Bollinger Bands, but in a simpler way: instead of calculating the bands' distance based on the price's standard deviation, it uses a fixed percentage above and below a moving average. The result is a channel that follows the average, within which the price usually moves most of the time.
In this article, you'll understand how Envelopes is calculated, how to configure it, and how to use its touches on the bands to identify possible price excesses.
How Envelopes is calculated
The calculation starts with a simple or exponential moving average, usually of an intermediate period, like 20. From it, the upper band is calculated by adding a fixed percentage to the average's value, and the lower band is calculated by subtracting that same percentage. If an asset's 20-period moving average is at R$ 40.00 and the configured percentage is 2.5%, the upper band sits at R$ 41.00 and the lower band at R$ 39.00.
Unlike Bollinger Bands, which automatically widen or narrow as the asset's volatility changes, the Envelopes bands always keep the same percentage distance from the average, unless the trader manually adjusts that percentage.
What touches on the bands usually indicate
When the price touches or goes past the upper band, it's interpreted as a sign the asset has moved quite far from its recent average, upward — a possible short-term overbuying excess. When it touches or goes past the lower band, the signal is the opposite: a possible overselling excess.
The most common reading is mean reversion: after touching one of the bands, the price would tend to move back toward the central moving average, and it's this return move that many traders try to capture. This type of reading works best in markets with no strong trend, oscillating within a relatively stable range.
Adjusting the bands' percentage
The ideal percentage varies quite a bit from asset to asset, and depends directly on each one's typical volatility. A historically more volatile asset may need a larger percentage, like 5%, for touches on the bands to actually represent an excess of movement, not just the normal day-to-day swing. A more stable asset may work better with a smaller percentage, like 1.5% or 2%.
Setting too small a percentage for a volatile asset makes the price touch the bands excessively often, which reduces the value of these signals as an indication of a real excess of movement.
Watch out for strong trends
Like any mean-reversion-based indicator, Envelopes can generate misleading signals during strong trends. In a consistent uptrend, the price can walk glued to the upper band for several candles in a row, without returning to the average — and anyone interpreting every touch as a sell signal under these conditions risks repeatedly trading against a trend that remains strong.
Because of that, it's worth checking the trend context before using touches on the bands as an entry trigger: in sideways markets, the reversal reading tends to work better; in strong trends, the touches serve more as a warning of a possible pause than as a signal of a full reversal.
Combining Envelopes with volume or momentum
One way to filter Envelopes' signals is to watch volume at the moment of the touch on the band. A touch on the upper band accompanied by shrinking volume suggests buying strength is already running out of steam, reinforcing the reading of a possible return to the average. A touch on the band with rising volume, on the other hand, can indicate the move still has strength to continue, even while far from the average.
A momentum oscillator, like the RSI, can also serve as additional confirmation: a touch on the upper band together with the RSI in overbought territory reinforces the excess hypothesis, while the same touch with the RSI at neutral levels calls for more caution before assuming the move will reverse.
Using Envelopes in practice
On Astron, you can adjust both the moving average's period and the bands' percentage, testing different combinations on specific assets until you find the configuration that best reflects that market's historical behavior. Like any mean-reversion indicator, Envelopes works best combined with a reading of the chart's context, and shouldn't be used in isolation as the sole entry criterion, since every trade carries real risk of loss.
Practice before you risk. Open your Astron account and test your ideas on the demo account with R$ 10,000 in virtual funds.
Create free account