

 Português pt
 Español es
 العربية ar
 বাংলা bn
 Deutsch de
 Filipino fil
 Français fr
 हिन्दी hi
 Bahasa Indonesia id
 Italiano it
 Русский ru
 Svenska sv
 ไทย th
 Türkçe tr
 Tiếng Việt vi
 简体中文 zh
How to Build an Entry Plan Using Candlesticks
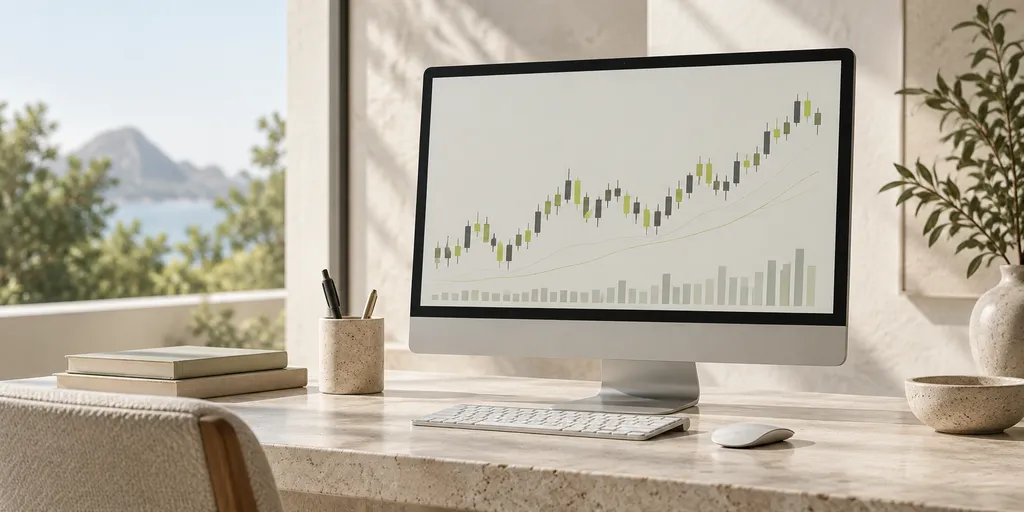
Beginners commonly memorize a list of candlestick patterns — hammer, engulfing, shooting star — and then go hunting for those formations on the chart as if they were automatic buy or sell signals. The problem is that the same candle can mean different things depending on where it shows up: a hammer in the middle of an uptrend carries much less weight than the same hammer appearing right after a string of declines, near a meaningful support level.
This article doesn't repeat the list of patterns; instead, it shows how to turn a candlestick reading into a complete entry plan, with context, confirmation, and risk management.
Why the candle alone isn't enough
A candlestick shows the fight between buyers and sellers over a single period: where the price opened, where it closed, and how far the high and low reached. That already delivers valuable information about who was in control, but it says nothing about the bigger picture — whether the asset is trending, moving sideways, or near an important technical level. A reversal pattern is worth much more when it appears in a spot that already makes sense for a reversal.
Step 1: identify the context before the candle
Before looking for any pattern, look at the chart on a larger timeframe and answer two questions: is the asset in an uptrend, a downtrend, or moving sideways? Is the candle showing up near a relevant support, resistance, or moving average? A bullish pattern that appears exactly on top of a support level tested several times carries much more weight than the same pattern in the middle of nowhere.
Step 2: read the candle within that context
With the context set, look at the size of the candle's body relative to the previous candles, the size of the wicks (which show price rejection), and whether the close ended up near the high or the low of the period. A reversal candle with a small body and a long wick in the direction opposite the recent move usually indicates a stronger rejection than a large-bodied candle with no wicks.
Step 3: wait for confirmation
Entering as soon as the pattern forms, without waiting for confirmation, is one of the most common mistakes. The most commonly used confirmation is the close of the next candle in the expected direction — for example, after a bullish reversal pattern near support, waiting for a candle to close above the pattern's high before buying, instead of jumping in halfway through the formation.
Step 4: build the trade with defined numbers
Practical example: an asset falls to R$ 18.00, forms a reversal pattern with a long lower wick, and the next candle closes at R$ 18.60, confirming the rejection. The trader enters long at R$ 18.65, places the stop loss at R$ 17.90 (below the pattern's low), and sets the target at R$ 20.10, near a previous resistance level. The risk is R$ 0.75 per share, and the potential gain is R$ 1.45, a ratio of nearly 2 to 1.
Step 5: use volume as an additional filter
A candle pattern with above-average volume at the moment of reversal tends to be more reliable than the same pattern formed on a day of weak volume, because high volume indicates greater real market participation in that rejection move. When volume comes in low, even a pattern with good visual appearance deserves a bit more caution before entering.
Common mistakes in this analysis
- Treating any long wick as a reversal pattern, without checking whether it actually appears at a relevant technical level.
- Entering without waiting for confirmation from the next candle, increasing exposure to false signals.
- Ignoring the underlying trend and trading reversals against a strong move just because a pattern showed up on the chart.
Candlesticks are a context-reading tool, not a guaranteed formula for being right — the same pattern can fail in similar situations, and the market can always move against expectations. Practicing this reading on a demo account, whether on Astron or any other charting platform, helps build a sense of when a pattern truly has context in its favor before risking real capital.
Practice before you risk. Open your Astron account and test your ideas on the demo account with R$ 10,000 in virtual funds.
Create free account