

 Português pt
 Español es
 العربية ar
 বাংলা bn
 Deutsch de
 Filipino fil
 Français fr
 हिन्दी hi
 Bahasa Indonesia id
 Italiano it
 Русский ru
 Svenska sv
 ไทย th
 Türkçe tr
 Tiếng Việt vi
 简体中文 zh
How to Choose the Best Timeframe for Your Profile
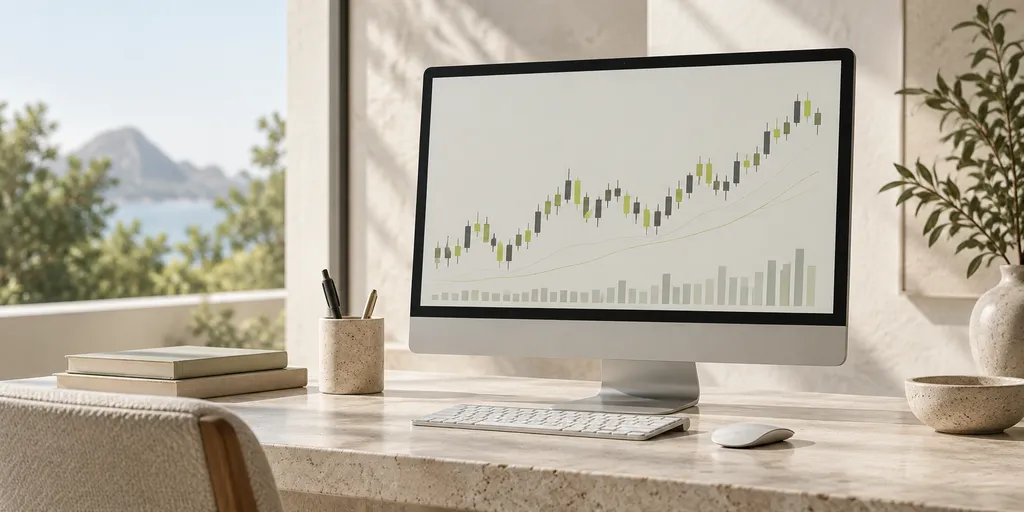
One of the first adjustments any trader needs to make on a charting platform is the timeframe, meaning the time interval each candle represents. This choice, often treated as a technical detail, actually defines much of your trading result — because the same asset can look like it's in an uptrend on a daily chart and in a bearish correction on a 15-minute chart, at the same time.
In this article, you'll understand the differences between the main timeframes, how each one relates to a trading style, and how to choose the one that fits your routine.
What changes from one timeframe to another
A 1-minute candle shows the price change only within that minute; a daily candle shows everything that happened over the entire day in a single bar. The shorter the timeframe, the more candles are generated per hour and the more sensitive the chart becomes to very short-term swings — often called "noise". The longer the timeframe, the fewer candles appear, but each one carries more information and tends to reflect more consistent moves.
That doesn't mean short timeframes are "worse": they're just more sensitive, and require faster decisions and greater continuous attention to the screen. Long timeframes require patience to hold positions longer, but each signal tends to be more reliable.
Short timeframes: 1 to 15 minutes
These intervals are used mainly by scalpers or day traders, seeking several small trades throughout the day and closing everything before the market closes. The advantage is the number of opportunities; the disadvantage is that short-term noise generates false signals more often, and trading costs (spread, brokerage) weigh proportionally more on small moves.
Trading on these timeframes requires available time to watch the chart live, quick decisions, and tighter emotional control, since results — positive and negative — show up within minutes.
Intermediate timeframes: 1 hour to 4 hours
These timeframes suit people who can't stay glued to the screen all day but still want to trade with some frequency, usually closing positions within a few hours or at most one or two days. It's a middle ground: less noise than minute charts, but still quick enough to generate signals regularly.
It's a good starting point for those with another job or commitment during the day who can check the chart a few times, instead of monitoring it continuously.
Long timeframes: daily, weekly
These intervals are the basis of swing trading and position trading, styles where positions stay open for days, weeks, or even months. Since each candle summarizes an entire period, trend and reversal signals tend to be more reliable, with less interference from momentary swings.
The trade-off is that stops, to make sense in the context of this timeframe, usually need to be larger — which requires a smaller position size to keep the risk per trade under control. For example, if an asset's daily ATR is R$ 2.00, a R$ 0.30 stop barely reflects the real volatility of that time frame.
How to decide which one to use
Choosing a timeframe should start with a practical question: how much time per day do you honestly have available to follow the market? Someone who can only look at the chart at night shouldn't trade minute timeframes, because they'll miss exactly the moment decisions need to be made.
Another factor is emotional tolerance for fast swings. Short timeframes produce results (gains and losses) in rapid succession, which requires more emotional control than trading on a daily chart, where there's time to reflect between one decision and the next.
A common practice is to use two timeframes together: a longer one to identify the overall trend and a shorter one to refine the entry point within that trend. On Astron, you can switch between timeframes on the same chart and compare how the same asset behaves on each before deciding which one to use consistently. Regardless of the chosen timeframe, the risk of loss exists at any time frame, and position size should always be compatible with how much you can lose without jeopardizing your capital.
Practice before you risk. Open your Astron account and test your ideas on the demo account with R$ 10,000 in virtual funds.
Create free account