

 Português pt
 Español es
 العربية ar
 বাংলা bn
 Deutsch de
 Filipino fil
 Français fr
 हिन्दी hi
 Bahasa Indonesia id
 Italiano it
 Русский ru
 Svenska sv
 ไทย th
 Türkçe tr
 Tiếng Việt vi
 简体中文 zh
How to Choose the Right Indicator for Your Strategy
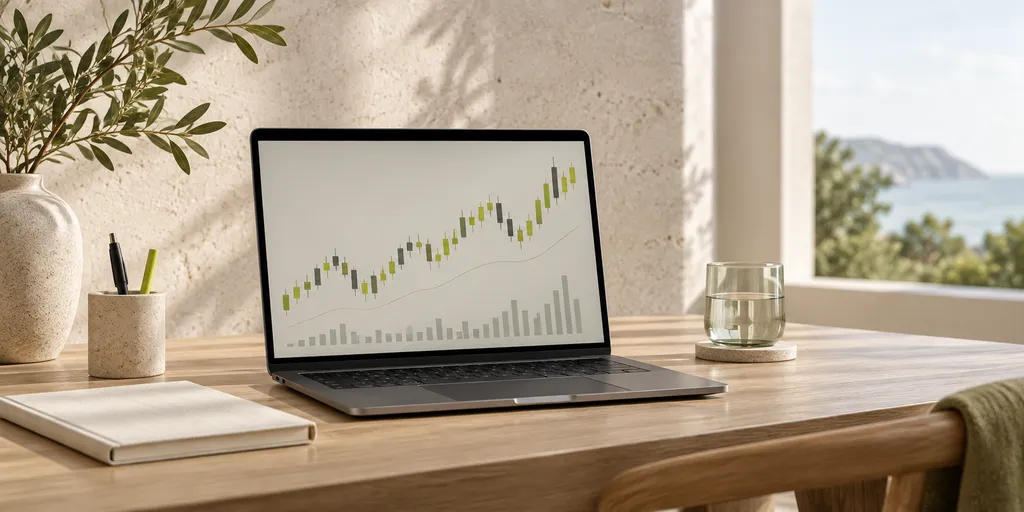
Opening a charting platform for the first time and seeing dozens of available indicators usually creates more confusion than help. The right question isn't "which is the best indicator", but "which indicator answers the question I need answered right now". Organizing indicators by function, not by popularity, is the first step toward choosing well.
The four questions indicators answer
Practically every technical indicator falls into one of four functional categories. Trend indicators, like moving averages and the MACD, answer the question "where has the price been heading, on average, lately". Momentum oscillators, like the RSI and the stochastic, answer "is this move strong, or already showing signs of running out of steam". Volatility indicators, like Bollinger Bands and the ATR, answer "how much is the price moving relative to its own recent pace". And volume indicators answer "how many participants are really validating this move".
Step 1: identify which question your strategy needs answered
Before choosing an indicator, it's worth clarifying what the strategy actually needs to know at that moment. A trend-following strategy needs, above all, a reliable answer about direction — which points to trend indicators as a starting point. A strategy that plays bounces within a price range needs more of a reading on move exhaustion — which points to momentum oscillators.
Step 2: consider the behavior of the asset you trade
Assets with more erratic moves and sudden volatility spikes tend to generate more false signals on momentum oscillators set with default parameters, requiring adjustments or a more cautious reading. Assets with longer-lasting trends usually respond better to longer-period trend indicators, which filter out short-term noise more effectively in that kind of behavior.
Step 3: combine at most two different categories
A common mistake is stacking five or six different indicators on the same chart, many from the same category — for example, three different momentum oscillators, which tend to show similar, redundant readings. Combining a trend indicator with a momentum one, for example, covers two different questions without overloading the analysis with repeated information.
An example of the selection process
Imagine someone trading an asset with well-defined medium-term trends, looking for entries within those trends. The first indicator chosen could be a longer-period moving average, to confirm the overall direction. The second could be the RSI, used not to predict a reversal of the main trend, but to identify pullbacks within it — entering, for example, when the RSI moves up from low values, still within an uptrend already confirmed by the moving average. This combination of two categories answers two complementary questions without redundancy.
Testing before adopting an indicator for good
After choosing candidates by function, the next step is to check, on a historical chart of the specific asset you trade, how often that indicator's signals actually preceded the expected move. An indicator can work very well for one type of asset and generate confusing signals for another, so this testing step avoids adopting a tool just because it worked well in a generic example seen elsewhere.
Signs that an indicator isn't fitting your strategy
If an indicator is frequently generating contradictory signals, if you catch yourself ignoring its signals because they "don't seem reliable", or if you're adding more indicators to try to "fix" the first one's confusing signals, these are good clues that it's worth going back to the original question: what information do I really need, and is this indicator answering it?
Adjusting parameters without overdoing it
After choosing the category and the indicator, there's still the step of adjusting the period used in the calculation — a 14-period RSI behaves differently from a 7-period RSI, for example. The goal of this adjustment is to fit the indicator's sensitivity to the pace of the asset being watched, not to find a "magic" number that would have perfectly nailed a specific stretch of the past, something that rarely repeats the same way in the future.
Practical conclusion
Choosing the right indicator starts by understanding what question your strategy needs answered, not by looking for the indicator with the strongest reputation among other traders. A lean combination, tested on the history of the specific asset you trade, tends to produce a clearer reading than a screen full of overlapping tools — but no combination, no matter how well chosen, eliminates the risk of loss in a trade.
Practice before you risk. Open your Astron account and test your ideas on the demo account with R$ 10,000 in virtual funds.
Create free account