

 Português pt
 Español es
 العربية ar
 বাংলা bn
 Deutsch de
 Filipino fil
 Français fr
 हिन्दी hi
 Bahasa Indonesia id
 Italiano it
 Русский ru
 Svenska sv
 ไทย th
 Türkçe tr
 Tiếng Việt vi
 简体中文 zh
Market Sentiment: How to Measure and Use It in Your Analysis
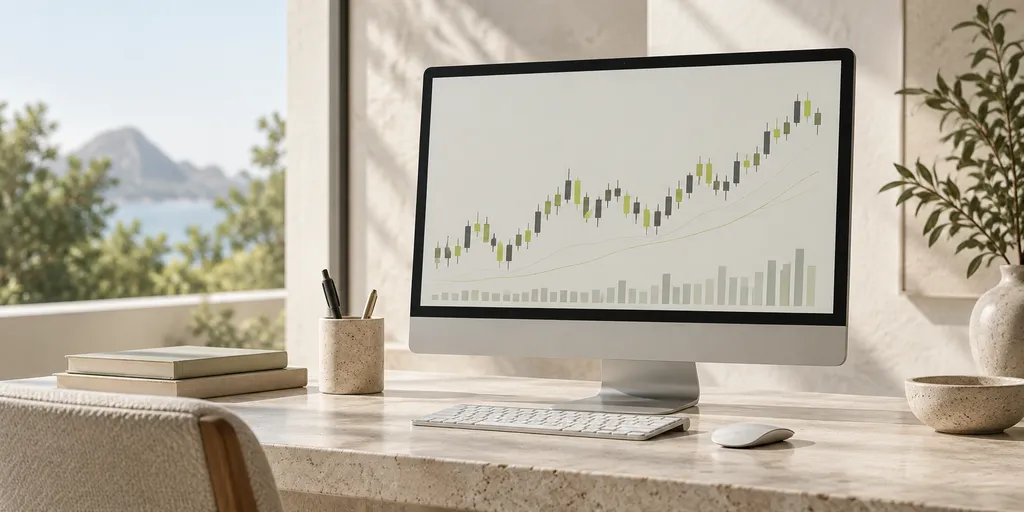
Not every price move comes from a clear, objective fundamental. Often, what pushes an asset up or down is simply the collective mood of market participants — optimism, fear, greed, or panic, in greater or lesser intensity. This set of collective emotions is called market sentiment, and learning to measure it is a skill that complements traditional technical and fundamental analysis.
Unlike a mathematical indicator based only on price, market sentiment tries to capture what participants are feeling and doing collectively, which can anticipate or explain moves that technical analysis alone wouldn't justify.
Why market sentiment matters
Prices don't move on their own: they reflect buy and sell decisions made by people and institutions, often influenced by news, expectations, and emotional reactions. In moments of excessive optimism, assets can become overvalued relative to any reasonable fundamental; in moments of panic, the opposite happens, with assets falling well beyond what the fundamentals would suggest. Recognizing these extremes helps understand when a move might be closer to its end than its beginning.
Tools used to measure sentiment
- Volatility indices: measure the level of uncertainty priced in by the market; spikes tend to coincide with moments of heightened fear.
- Investor positioning: reports showing whether most participants are long or short a given asset, used by some traders as a contrarian signal when positioning becomes extremely one-sided.
- Trading volume: volume spikes, especially alongside sharp price moves, tend to reflect meaningful shifts in sentiment between buyers and sellers.
- Relative strength indicators between assets: comparing the performance of assets considered riskier with those considered safer helps gauge whether overall risk appetite is rising or falling.
How to interpret sentiment extremes
A common read among more experienced traders is to be wary of widespread optimism — when practically everyone seems to agree an asset will only go up, the room for new buyers to step in is often already reduced, increasing the risk of a correction. The same holds in reverse: extreme, widespread pessimism sometimes precedes reversals, since most sellers have already sold and there's less additional selling pressure left.
It's important to stress that this isn't a fixed rule or an automatic entry trigger — extreme sentiment can stay extreme for quite a while before reversing, and trading purely against the consensus, without other confirming signals, is a risky strategy on its own.
A practical example of a combined read
Imagine an asset in a strong rally, with successive optimistic headlines, growing trading volume, and most positioning reports showing investors heavily long. At the same time, the price starts forming candles with long upper wicks, suggesting rejection at the highs. A trader watching market sentiment can use this combination of signals — excessively optimistic sentiment plus a technical rejection signal — as a reason to reduce long exposure or tighten risk management on already open positions, instead of increasing exposure further just because the news looks good.
How to incorporate sentiment into your analysis routine
Market sentiment works best as an additional layer of context, not as a standalone strategy. Combining it with technical analysis — support, resistance, trend — and with relevant fundamental information tends to produce a more complete read than relying on any single one of these elements alone. As with any market approach, no sentiment read guarantees the outcome of a trade, and risk control remains essential regardless of how optimistic or pessimistic the market seems at a given moment.
Sources of sentiment beyond the numbers
Not every sentiment read comes from a numeric indicator. News headlines, the general tone of analyst reports, and even how often a given topic appears in widely followed outlets can serve as qualitative clues about the market's prevailing mood. An unusual volume of euphoric news about the same asset, for example, is often a sign that optimism is already quite widespread, which reduces the room for new positive surprises to push the price even higher.
The challenge with these qualitative sources is that they're harder to measure objectively than a numeric index. That's why many traders treat them as a complement to reading quantitative indicators, not as the main basis for analysis. Combining different sources — quantitative and qualitative — tends to reduce the chance of a read being distorted by a single isolated event, helping form a more balanced view of the prevailing sentiment at a given moment in the market.
Practice before you risk. Open your Astron account and test your ideas on the demo account with R$ 10,000 in virtual funds.
Create free account