

 Português pt
 Español es
 العربية ar
 বাংলা bn
 Deutsch de
 Filipino fil
 Français fr
 हिन्दी hi
 Bahasa Indonesia id
 Italiano it
 Русский ru
 Svenska sv
 ไทย th
 Türkçe tr
 Tiếng Việt vi
 简体中文 zh
What Is Price Action and How to Use It in Practice
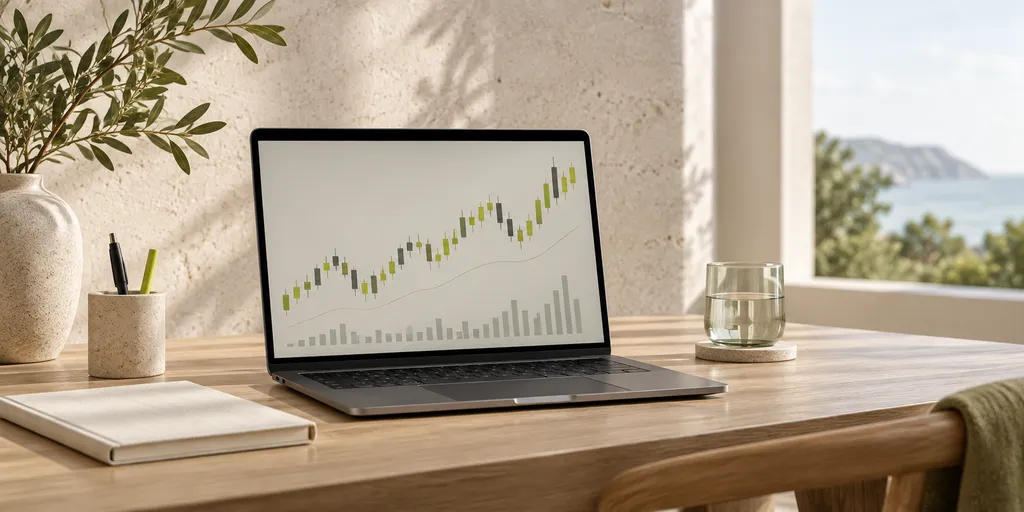
Before any colorful indicator appears on the chart, there is a piece of information that never changes: price itself, and the way it moves over time. That's exactly what price action studies. Instead of calculating averages, oscillators, or statistical formulas, a trader who uses price action observes candles, highs, lows, and market behavior in specific regions to make decisions.
This method is popular precisely because it simplifies analysis: fewer screens full of lines, more attention to what really matters — the fight between buyers and sellers recorded right on the chart.
What price action actually is
Price action is the analysis of the price sequence — highs, lows, opens, and closes — without using derived indicators, such as moving averages or RSI. The logic is simple: every indicator is calculated from price, so why not study price directly, at the source?
This doesn't mean abandoning every tool altogether. Many traders combine price action with support and resistance lines, trend, and volume, but the final decision comes from reading the candles and the structure of the chart.
The basic elements you need to recognize
- Candles: each candle shows the open, close, high, and low of a period. The size of the body and wicks already tells a story about who dominated that interval.
- Highs and lows: the sequence of highs and lows defines whether the market is trending up, trending down, or moving sideways.
- Support and resistance zones: price regions where the market has reacted in the past and tends to react again.
- Reversal and continuation patterns: engulfings, hammers, stars, and other formations that signal a change or continuation of the move.
How to build a price action read, step by step
There's no magic formula, but a routine helps organize the reasoning:
- Identify the dominant trend by observing the recent sequence of highs and lows.
- Mark the main support and resistance zones on the chart.
- Wait for the price to reach one of these zones before looking for an entry signal.
- Look for a candle pattern that confirms the expected reaction in that region.
- Define the risk before entering, with a stop at a point that would invalidate the read.
A simple numeric example
Imagine an asset that keeps repeating reactions near R$ 50.00, a resistance tested three times over recent weeks. A trader using price action waits for the price to approach R$ 50.00 again and watches for a rejection candle to form, such as a long upper wick with a close near the low. With that, they consider a sell with a stop at R$ 50.80 (above the resistance) and a target at R$ 48.50, near the last relevant low. In this scenario, the risk is R$ 0.80 per unit and the potential gain is R$ 1.50 — a risk-reward ratio of almost 1 to 2, calculated before any execution.
Common mistakes made by beginners
The most frequent mistake is trying to trade every move on the chart, without waiting for a relevant zone. This generates excessive trades and weak signals. Another problem is ignoring the bigger picture: a reversal candle near strong resistance carries different weight than the same candle in the middle of nowhere. Finally, many people forget to define the stop before entering, which turns an objective technique into an emotional bet.
It's worth remembering that no price action read guarantees a win — it's a way to organize probabilities, not a certainty. Trading without risk control, even with a technically correct read, can lead to significant losses.
In practice, price action works best as a lens to simplify decisions: fewer screens, more focus on what the market is actually showing. If you're starting out, it's worth testing this approach on a demo account, logging each entry and the reasoning behind it, before trading with real money, whether at a traditional broker or on a platform like Astron.
How context changes the weight of each signal
The same candle pattern can mean different things depending on where it appears on the chart. A hammer near strong resistance, within an already mature downtrend, carries more weight than the same hammer isolated in the middle of a price range with no relevant history. That's why those who study price action seriously learn to look first at the bigger picture — the asset's trend across different timeframes — before reacting to a single isolated candle.
It's also worth watching trading volume, when available: a reversal move accompanied by higher volume tends to be more consistent than the same move on a day of weak trading. None of these elements guarantee a correct call on their own, but together they form a more complete read than deciding based on a single signal, without looking at the scenario around it.
Practice before you risk. Open your Astron account and test your ideas on the demo account with R$ 10,000 in virtual funds.
Create free account