

 Português pt
 Español es
 العربية ar
 বাংলা bn
 Deutsch de
 Filipino fil
 Français fr
 हिन्दी hi
 Bahasa Indonesia id
 Italiano it
 Русский ru
 Svenska sv
 ไทย th
 Türkçe tr
 Tiếng Việt vi
 简体中文 zh
Rainbow Moving Average: How to Use This Trend Indicator
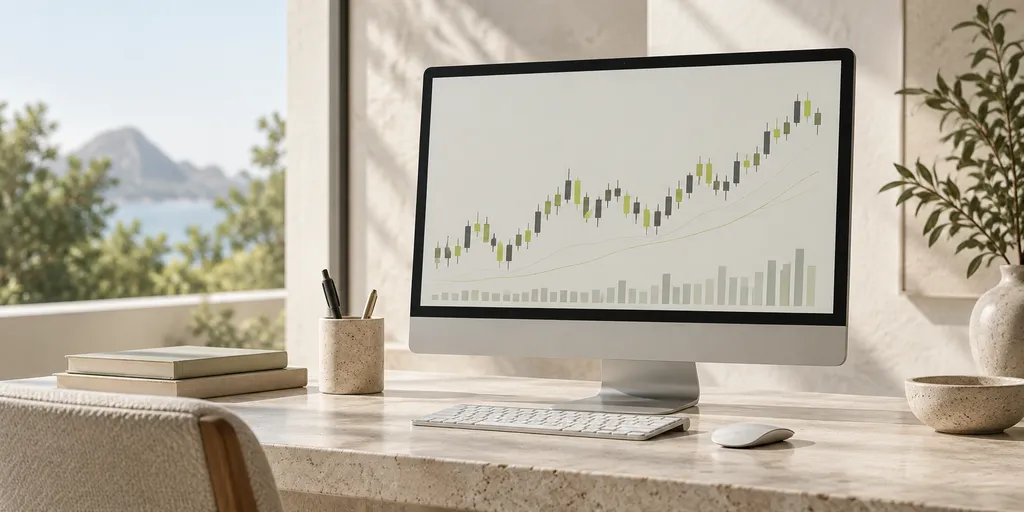
Among the less-discussed trend indicators, the Rainbow Moving Average stands out for its look: several increasing-period moving averages, plotted together on the same chart, forming colored bands that widen and narrow as trend strength changes. The name is literal — when well configured, the indicator really does resemble a rainbow over the price.
How the indicator is built
The logic is simple to understand, even though the calculation behind it looks complex. Instead of using a single moving average, the indicator applies a sequence of averages, each one smoothing the previous one — for example, a 2-period average of the price, then a 2-period average of that first average, and so on, repeating the process about a dozen times. The result is a set of lines with slightly different lags between them, colored to make visually reading their order easier.
What the width and order of the bands reveal
When the market is in a strong, consistent trend, the rainbow's lines line up in order, one above the other, and the band between them widens, showing a clear separation between the shorter- and longer-period averages. When the market loses direction and enters consolidation, the lines get tangled, cross each other repeatedly, and the band narrows, forming what's usually called a "knot" in the middle of the rainbow.
This visual reading works as a trend-strength thermometer: a wide, orderly band indicates an established trend; a narrow, tangled band indicates indecision, a moment when entry signals tend to be less reliable.
Entry and exit signals
The most used signal is the "knot" breakout: when the rainbow's lines, previously tangled, start organizing into a clear sequence and the band starts widening, that's read as the start of a new trend. More conservative traders wait for the price to close consistently above (or below) the whole set of averages before considering that a stronger confirmation.
For the exit, many watch for the moment the band starts narrowing again, or when the price crosses back inside the rainbow, signaling that the trend sustaining the trade is losing strength.
An example with numbers
Imagine an asset in consolidation, oscillating between R$ 18.50 and R$ 19.20 for several days, with the rainbow's averages tangled in that narrow R$ 0.70 range. On a given day, the price breaks above R$ 19.20 with force and the averages start lining up, with the shortest above the longest, opening a band that measures R$ 1.10 a few days later, between R$ 19.80 and R$ 20.90. This band widening, tracking the rising price, is the type of visual signal the indicator was designed to highlight.
Combining the rainbow with other tools
Since the indicator is, fundamentally, a trend reading, it doesn't say much about exact entry points within that trend. An oscillator like the RSI, used alongside it, helps identify pullback moments within the trend already confirmed by the rainbow — avoiding entering right at the top of a move that has already run a lot. Volume also helps validate whether the "knot" breakout has real market participation behind it, and isn't just a move on a handful of trades.
Precautions when using the indicator
Since it's made up of several moving averages, the rainbow has a natural lag: it confirms trends that have already started, it doesn't predict a move's exact beginning. In markets that quickly alternate between trend and consolidation, the indicator can generate late signals, with the band widening right near the end of the move. Because of that, it works best on longer time frames or on assets that historically sustain trends for longer periods.
Wrapping up
The Rainbow Moving Average offers a visually intuitive way to measure trend strength and direction, especially useful for those who struggle to interpret several separate moving averages on the same chart. Like any average-based indicator, it reacts to price with a lag, so it's worth testing it on different assets and time frames before incorporating it into your analysis routine, always remembering that no technical tool eliminates the risk of loss.
Practice before you risk. Open your Astron account and test your ideas on the demo account with R$ 10,000 in virtual funds.
Create free account