

 Português pt
 Español es
 العربية ar
 বাংলা bn
 Deutsch de
 Filipino fil
 Français fr
 हिन्दी hi
 Bahasa Indonesia id
 Italiano it
 Русский ru
 Svenska sv
 ไทย th
 Türkçe tr
 Tiếng Việt vi
 简体中文 zh
RVI: How to Use the Relative Vigor Index in Technical Analysis
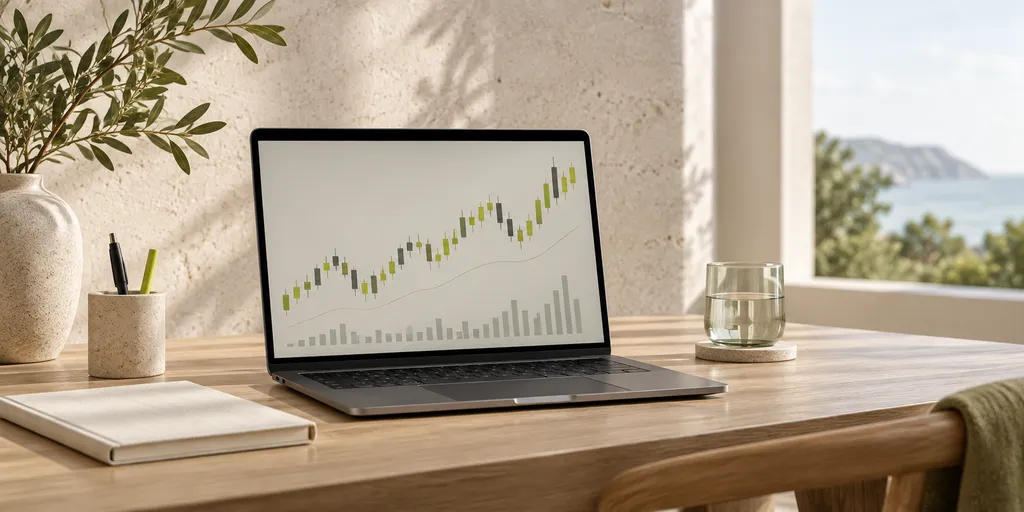
The Relative Vigor Index, known by the acronym RVI, is a momentum indicator that tries to answer a simple question: is the force pushing the price up or down really sustained, or is it just a passing jolt? Unlike moving averages, which only look at where the price is heading, the RVI looks at how the candle formed, comparing the close with the open and relating that difference to the period's total range.
The logic behind this comes from the observation that, in healthy uptrends, prices tend to close near the candle's high. In downtrends, the opposite happens: the close ends up near the low. When that stops happening, even while the price is still rising or falling, the RVI already signals that the move's momentum is weakening.
How the RVI is calculated
The basic formula for a single candle is: RVI = (Close − Open) ÷ (High − Low). The result ranges between -1 and 1. Values close to 1 show a candle with strong buying strength, with the close glued to the high. Values close to -1 indicate the opposite, dominant selling pressure.
In practice, no one uses a single candle's value, because the noise would be huge. Because of that, the version used on analysis platforms smooths this calculation with a simple moving average, usually 10 periods, on both the numerator and the denominator. The result is a more stable line, accompanied by a second line, called the signal line, usually a 4-period weighted average of the RVI itself. It's the crossover between these two lines that most traders watch.
How to interpret the signals
The most common signal is the crossover: when the RVI crosses the signal line from below to above, many traders see that as an indication buying strength is gaining ground. The reverse crossover, from above to below, suggests the opposite. These crossovers work best when they confirm a move that already exists on the price chart, not as an isolated trigger.
The second use, more valuable for those with some experience, is divergence. If an asset's price makes a new high, but the RVI makes a lower high than the previous one, that's a bearish divergence: the price rose, but the vigor behind the rise decreased. The reverse reasoning applies to bottoms: price making a lower low while the RVI rises is a sign selling pressure may be running out.
A numerical example
Imagine a stock trading at R$ 38.00 at the session's open. During the day it swings between a low of R$ 37.80 and a high of R$ 39.50, closing at R$ 39.20. Applying the single-candle formula: (39.20 − 38.00) ÷ (39.50 − 37.80) = 1.20 ÷ 1.70 = 0.70. This isolated value already shows a strong candle, with the close very close to the day's high. If, over the following days, the price keeps rising but this calculated ratio keeps falling to 0.50, then 0.30, that shows declining vigor even while the price is still rising — a warning the trend may be running out of fuel even before reversing on the chart.
Common mistakes and precautions when using the RVI
The first mistake is treating the RVI as a perfect anticipatory indicator. By construction, it's a confirmation and strength indicator, not a predictor of the next candle. The second mistake is using it alone: like any price-based oscillator, it can generate false signals in markets with no defined direction, going back and forth around the signal line without anything relevant happening to the price. Because of that, many traders combine the RVI with a broader trend reading, like a longer-period moving average, using the oscillator only to time entries within an already identified direction.
It's also worth remembering that no technical indicator guarantees a result. The RVI helps organize the reading of a move's strength and weakness, but the market can invalidate any signal at any moment, and trading always carries risk of loss.
Putting the RVI into practice
For beginners, a simple way to test the indicator is to watch an asset you already follow and note, for a week, the crossovers between the RVI and the signal line, comparing them with what happened to the price shortly after. This builds a personal reference for how the indicator behaves on that specific asset, before considering using it to make real decisions. On a platform like Astron, you can add the RVI to the chart and view this behavior side by side with the price, which makes this kind of study much easier before any trade.
Practice before you risk. Open your Astron account and test your ideas on the demo account with R$ 10,000 in virtual funds.
Create free account