

 Português pt
 Español es
 العربية ar
 বাংলা bn
 Deutsch de
 Filipino fil
 Français fr
 हिन्दी hi
 Bahasa Indonesia id
 Italiano it
 Русский ru
 Svenska sv
 ไทย th
 Türkçe tr
 Tiếng Việt vi
 简体中文 zh
Technical Analysis in Forex: Does It Really Work?
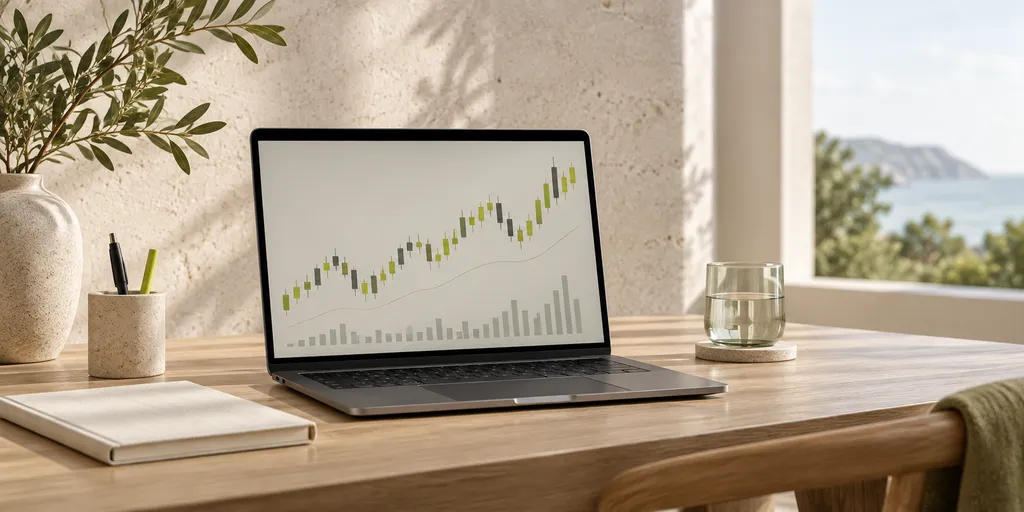
When it comes to the currency market, it's common to hear opposite opinions about technical analysis: for some, it's the foundation of any serious trading; for others, it's nothing more than an exercise in finding patterns where only price noise exists. The truth lies somewhere in between, and understanding exactly where helps avoid both overconfidence and giving up on the tool too early.
In this piece you'll see what technical analysis can really deliver in the forex market, in which situations it tends to fail, and how to calculate a pip's value to size trades with more criteria, instead of trading by guesswork.
What technical analysis really does
Technical analysis starts from a simple premise: a currency pair's price reflects all the information available at that moment, and past behavior tends to repeat in patterns that can be identified on charts. Tools like moving averages, support and resistance lines, or strength indicators like the RSI don't predict the future, but they help organize the reading of the market and define entry, exit, and stop points more objectively.
In forex, this organization matters even more because the market operates almost 24 hours a day, five days a week, and without a method the trader is exposed to decisions made on impulse, in the heat of a news event or a sharp price move.
Where technical analysis tends to fail
The first common mistake is treating an indicator as a fixed rule, without considering context. A moving average crossover can generate false signals in a sideways market with no defined trend, exactly the kind of scenario most common in day-to-day forex. The second mistake is ignoring the economic calendar: central bank interest rate decisions, inflation data, and employment figures move currency pairs with a force that no technical indicator can anticipate.
There's also the mistake of overcrowding the screen with indicators. Stacking RSI, MACD, Bollinger Bands, and three more moving averages on the same chart tends to generate contradictory signals, and the trader ends up picking the signal that confirms what they already wanted to do, instead of letting the analysis guide the decision.
How to calculate a pip's value, in practice
To turn a technical reading into a risk decision, you need to know how much each price move is worth. On the USD/BRL pair, a pip corresponds to a 0.0001 change in the quote. Suppose a position of 1,000 units of the currency, the equivalent of a micro lot. Each pip's value is calculated like this: 0.0001 multiplied by 1,000, which results in R$ 0.10 per pip.
If the price moves 50 pips in favor of the trade, the result is 50 multiplied by R$ 0.10, that is, R$ 5.00 in gains on that position. The same calculation applies the other way: if the market moves 50 pips against the trade, the loss will also be R$ 5.00. This kind of simple math is what lets you define, before entering the trade, how many pips of stop make sense for the position size and the available capital.
How to know if technical analysis is working for you
The only reliable way to answer that question is with your own data, not someone else's opinion. Keeping a trading journal, noting the setup used, the reason for the entry, and the result, lets you see, after a few dozen trades, whether that specific pattern has been working on your pair and at your trading hours. Testing signals first on historical charts, with no money at risk, also helps calibrate expectations before trading with real capital on a platform like Astron.
It's worth remembering that no technical analysis tool eliminates risk. It organizes the reading of the market and helps make more consistent decisions, but unexpected moves can always happen, which is why position size and stop loss remain just as important as the signal that motivated the entry.
In practice, technical analysis works best as part of a process, not as a magic formula. Combine chart signals with the economic calendar, define the pip's value before opening the position, record the results, and adjust the method over time. This set of habits is what separates those who use technical analysis consistently from those who just collect indicators on the screen without a plan behind them.
Practice before you risk. Open your Astron account and test your ideas on the demo account with R$ 10,000 in virtual funds.
Create free account