

 Português pt
 Español es
 العربية ar
 বাংলা bn
 Deutsch de
 Filipino fil
 Français fr
 हिन्दी hi
 Bahasa Indonesia id
 Italiano it
 Русский ru
 Svenska sv
 ไทย th
 Türkçe tr
 Tiếng Việt vi
 简体中文 zh
ZigZag Indicator: How to Filter Chart Noise
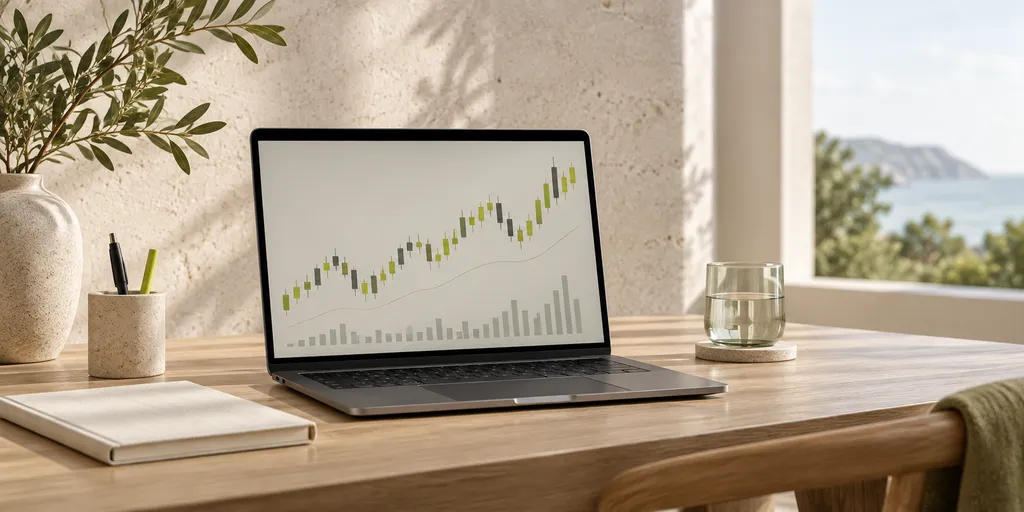
Looking at an unfiltered price chart can be exhausting: dozens of small ups and downs compete for attention, making it hard to see the truly relevant move behind all that noise. The ZigZag exists precisely to solve this visual problem, drawing straight lines that connect only the chart's significant highs and lows, ignoring what falls in between.
This article explains how the ZigZag decides what's noise and what's relevant movement, what it's actually useful for in practice, and why it shouldn't be confused with an entry-signal generator.
How the ZigZag decides what to show
The indicator is configured with a minimum change threshold, defined as a percentage of the price or a number of points. Any move smaller than that threshold is ignored, and the ZigZag only draws a new line when the price moves enough to exceed that threshold from the last identified high or low. For example, with a 5% threshold, a 2% swing in the middle of a trend simply doesn't show up on the indicator — it only enters the drawing once the accumulated move exceeds the defined 5%.
What the ZigZag is actually useful for
Identifying relevant highs and lows
By removing short-term noise, it becomes easier to see where the reversal points that truly mattered in the asset's history are — useful information for drawing support and resistance lines with more confidence than trying to guess it on a chart full of small swings.
Supporting chart pattern reading
Patterns like double top, head and shoulders, or trend channels become more evident once the ZigZag has already eliminated the smaller noise, working as a visual skeleton on which these patterns can be identified more clearly, including for those who study wave counting in technical analysis. Without this filter, it would be much harder to visually separate which leg of the chart represents the main move and which is just a correction within it.
Measuring the size of past moves
Since each ZigZag line connects a high to a low (or vice versa), it makes it easy to quickly measure how many points or what percentage the asset moved on each leg of the chart, which helps calibrate target expectations based on past moves of similar size.
The ZigZag's most important limitation
The ZigZag is an indicator that looks backward: it only confirms a high or low after the price has already moved enough in the opposite direction to prove that point was indeed a reversal. This means the indicator's last line can change, or repaint, as new candles form — the high that seemed definitive a moment ago can stop existing if the price keeps rising. For that reason, using the ZigZag as a direct entry trigger is risky: by the time the signal appears clearly, the move it describes has already happened. This makes the ZigZag more of a retrospective tool than an anticipatory indicator.
How to adjust the sensitivity parameter
- A small threshold (for example, 1% or 2%) shows more detail, but brings back a lot of short-term noise.
- A larger threshold (for example, 8% or 10%) simplifies the chart a lot, but can ignore reversals relevant for shorter-term trades.
- The ideal setting depends on the asset and the chart timeframe: more volatile assets generally need a larger threshold to avoid excessive noise, and the opposite applies to more stable assets.
How to use the ZigZag responsibly
The best way to take advantage of the ZigZag is as a visual analysis and historical study tool, not as an entry trigger. Combine the reading of the highs and lows it highlights with a momentum indicator, like the RSI, or with a volume reading, to decide the actual moment to enter a trade. Like any tool based on data that has already occurred, the ZigZag doesn't predict the next move, and the risk of loss remains present even with a visually more organized chart — it's worth studying its behavior on a demo account before incorporating it into your analysis routine.
Practice before you risk. Open your Astron account and test your ideas on the demo account with R$ 10,000 in virtual funds.
Create free account